Error Taxonomy
10 modules, 31 categories, 154 error codes.
Risicare classifies agent errors using a hierarchical taxonomy designed for AI systems. The taxonomy covers both single-agent failures (perception, reasoning, tool use, memory, output) and multi-agent failures (coordination, communication, orchestration, consensus, resources).
What the SDK Assigns Today
The taxonomy has 154 codes. The SDK gives a code to an exception that leaves a traced call: a decorated function, a with block of the tracer, or a provider call that is not a stream. It also gives a code to an exception that you pass to report_error(). It uses keyword rules, and those rules can assign only some of the codes.
A span gets no code when it is only marked as an error, when you record the exception with span.record_exception(), or when it is an error span of the LangChain integration.
- Python and JavaScript: the same 19 codes.
COMMUNICATION.DELIVERY.UNDELIVERABLE,CONSENSUS.AGREEMENT.QUORUM_FAILED,COORDINATION.WORKFLOW.DEADLOCK,MEMORY.CONTEXT_WINDOW.EXCEEDED,MEMORY.STATE.CORRUPTED,ORCHESTRATION.LIFECYCLE.CRASHED,OUTPUT.SAFETY.PII_LEAK,PERCEPTION.INPUT.ENCODING,PERCEPTION.INPUT.INJECTION,PERCEPTION.INPUT.MALFORMED,PERCEPTION.PARSING.JSON_INVALID,REASONING.HALLUCINATION.FACTUAL,REASONING.LOGIC.CONTRADICTION,RESOURCES.QUOTA.EXCEEDED,TOOL.EXECUTION.CRASHED,TOOL.EXECUTION.DEPENDENCY_FAILED,TOOL.EXECUTION.RATE_LIMITED,TOOL.EXECUTION.TIMEOUT,TOOL.INVOCATION.PERMISSION_DENIED.
An error that matches no rule gets TOOL.EXECUTION.CRASHED. The two SDKs give the same code for the same error (checked on a shared set of 147 error inputs). The other codes are for the diagnosis pipeline, which is held for the beta.
Taxonomy Structure
Module (10)
└── Category (31)
    └── Error Code (154)
        └── Format: MODULE.CATEGORY.CODE
Modules Overview
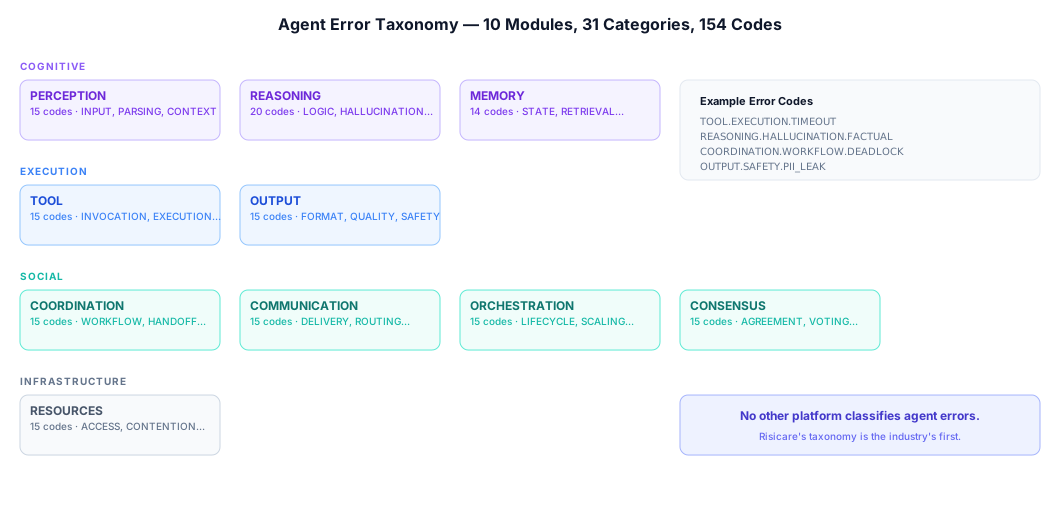
PERCEPTION
Input processing and understanding failures
REASONING
Cognitive and logic failures
TOOL
Tool and action execution failures
MEMORY
State and context management failures
OUTPUT
Response generation failures
COORDINATION
Multi-agent workflow coordination failures
COMMUNICATION
Inter-agent messaging failures
ORCHESTRATION
Agent lifecycle and management failures
CONSENSUS
Agreement and conflict resolution failures
RESOURCES
Shared resource management failures
Quick Reference
| Module | Categories | Codes | Focus |
|---|---|---|---|
| PERCEPTION | INPUT, PARSING, CONTEXT | 15 | Input processing, validation, context |
| REASONING | LOGIC, HALLUCINATION, PLANNING, DECISION | 20 | Logic, inference, planning, decisions |
| TOOL | INVOCATION, EXECUTION, RESULT | 15 | Tool calling, execution, results |
| MEMORY | STATE, RETRIEVAL, CONTEXT_WINDOW | 14 | State management, retrieval, context window |
| OUTPUT | FORMAT, QUALITY, SAFETY | 15 | Formatting, quality, safety |
| COORDINATION | WORKFLOW, HANDOFF, SYNCHRONIZATION | 15 | Workflow, handoffs, synchronization |
| COMMUNICATION | DELIVERY, CONTENT, ROUTING | 15 | Message delivery, content, routing |
| ORCHESTRATION | LIFECYCLE, SCALING, DELEGATION | 15 | Lifecycle, scaling, delegation |
| CONSENSUS | AGREEMENT, CONFLICT, VOTING | 15 | Agreement, conflict resolution, voting |
| RESOURCES | ACCESS, CONTENTION, QUOTA | 15 | Access control, contention, quotas |
Error Code Format
TOOL.EXECUTION.TIMEOUT
  │      │        │
  │      │        └── Code (specific error)
  │      └── Category (error type)
  └── Module (system area)
Severity Levels
Each error code has a severity from 1 to 5:
| Level | Name | Description |
|---|---|---|
| 5 | Critical | System failure, data loss, or safety risk |
| 4 | High | Task failure requiring intervention |
| 3 | Medium | Degraded performance or partial failure |
| 2 | Low | Recoverable issue with minimal impact |
| 1 | Info | Informational, no action needed |
Using Error Codes
In the API
Not available with an API key during the beta. The Management API routes that filter diagnoses and fixes by error code cannot be reached, so you cannot query by taxonomy code over HTTP today.
In Dashboards
The traces view filters on time window, errored-or-completed status,
environment, and a free-text search box. That search matches the root span
name and a trace-ID prefix only — typing an error code into it will not
find traces carrying that code. There is no error-code filter control and no
field:value search syntax.
In Alerts
Alert rules are metric-and-threshold, not per-error-code expressions. A rule names one metric, an operator, and a numeric threshold:
| Supported metric | Meaning |
|---|---|
error_rate | Errored share of traces in the window |
latency_p50 / latency_p95 / latency_p99 | Duration percentiles across the window |
trace_volume | Trace count |
cost_usd | Cost in USD over the rule's window |
total_tokens | Token count |
Operators are gt, lt, eq, gte, lte, ne. A rule can name only a
metric in this list.
You cannot alert on a specific error code today — error_rate counts all
errors together.
In Fixes
Each fix targets exactly one error code, in the singular field
target_error_code:
{
  "fix_type": "retry",
  "target_error_code": "TOOL.EXECUTION.TIMEOUT",
  "config": { "max_retries": 3, "initial_delay_ms": 1000, "exponential_base": 2.0 }
}
Next Steps
Select a module to see all its error codes: